library(ggplot2)

ggplot(aes(x = hwy, y = cty, colour = manufacturer), data = mpg) +
  geom_point()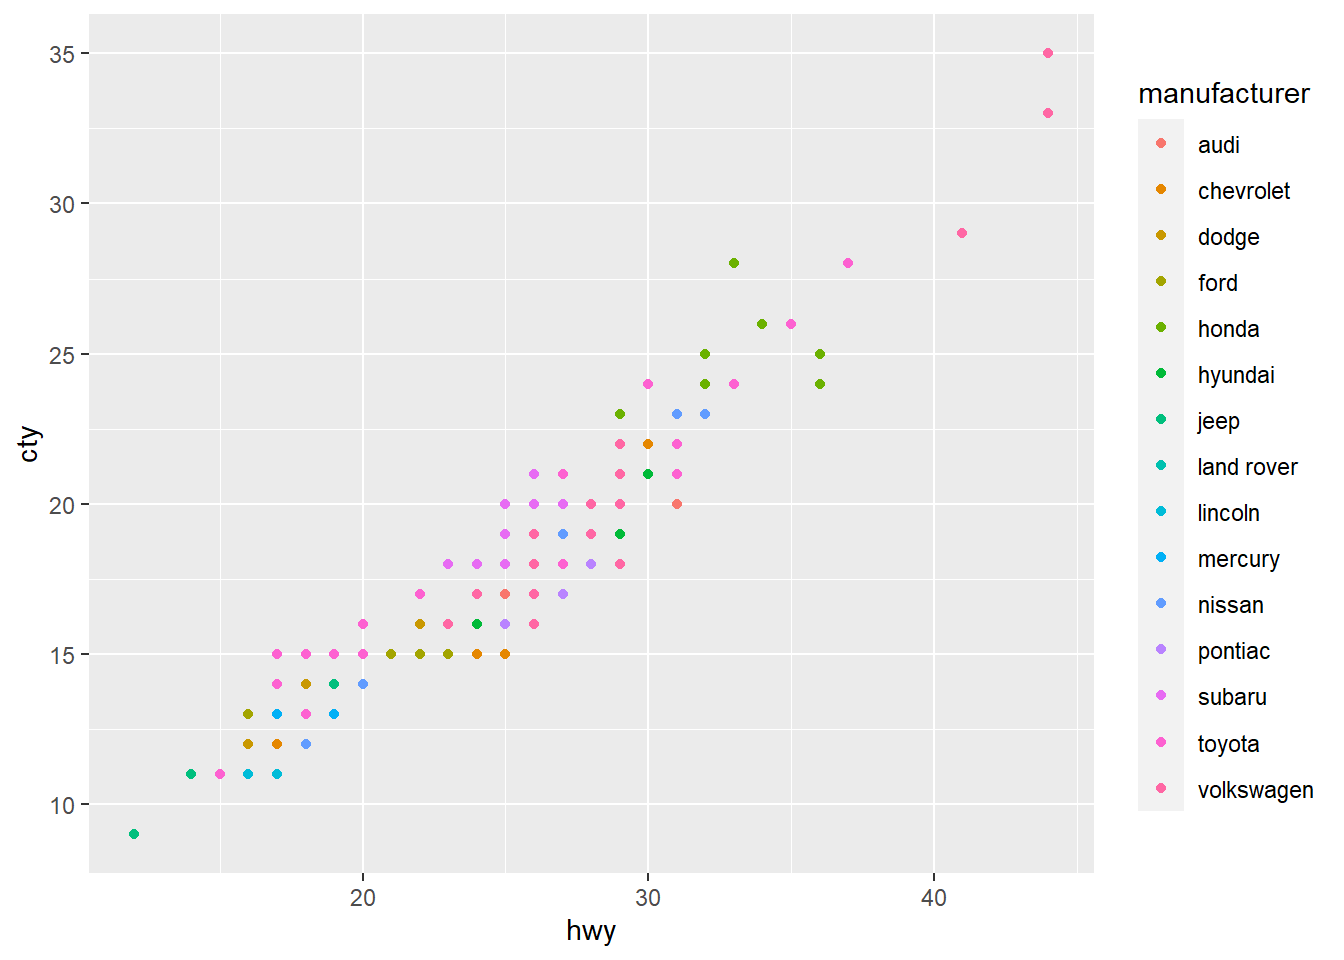
I visit Emil Hvitfeldt’s excellent resource cataloguing ggplot2 colour palettes at least once a week, and I usually go back to the same two packages (Nord and LaCroixColoR). The last few times I visited I’ve noticed a link to Simon J’s tutorial for making your own package.
As part of my QA roles, I often like to use corporate colours. Ironically LaCroixColoR has some close approximations to Edinburgh’s branding, but I thought I really should try to use them more.
Simon J’s tutorial is excellent and helped me understand some key concepts that passed me by. Now UoEColouR is up and running, I can definitely see myself making more palettes, so this resource is about documenting that process because I refuse to remember anything for longer than ten seconds.
This post has several sections:
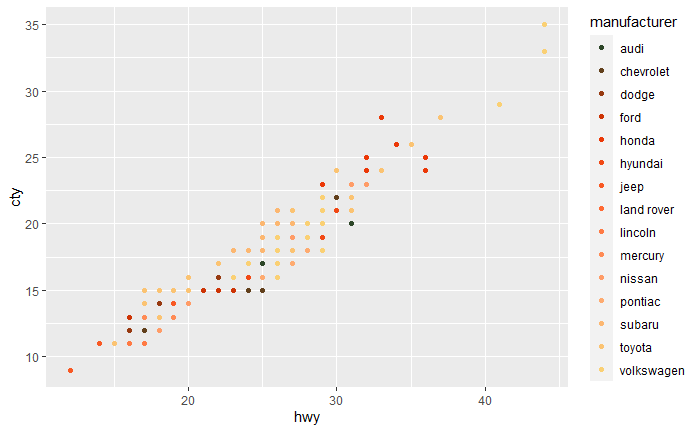
When visualising data in ggplot2, you often want to add a ‘fill’ or ‘colour’ aesthetic to your data, such as the use of the colour aesthetic below:
library(ggplot2)
ggplot(aes(x = hwy, y = cty, colour = manufacturer), data = mpg) +
geom_point()
A ggplot2 palette is simply a list of colours in a way that R can understand: hex values. If you’re not sure what hex values are, see this tutorial. The second, and possibly most important part of a ggplot2 palette, is that there needs to be a function to tell ggplot2 how to choose colours. Most often, we don’t want to need to define every colour we need, instead we want ggplot2 to look at the preset colours and choose an appropriate number or make some up if there’s not enough.
I really like the way my two favourite palettes do this, with a command like scale_nord, e.g. scale_fill_nord or scale_colour_nord
library(nord)

ggplot(aes(x = hwy, y = cty, colour = manufacturer), data = mpg) +
  geom_point() +
  scale_colour_nord(palette = "victory_bonds")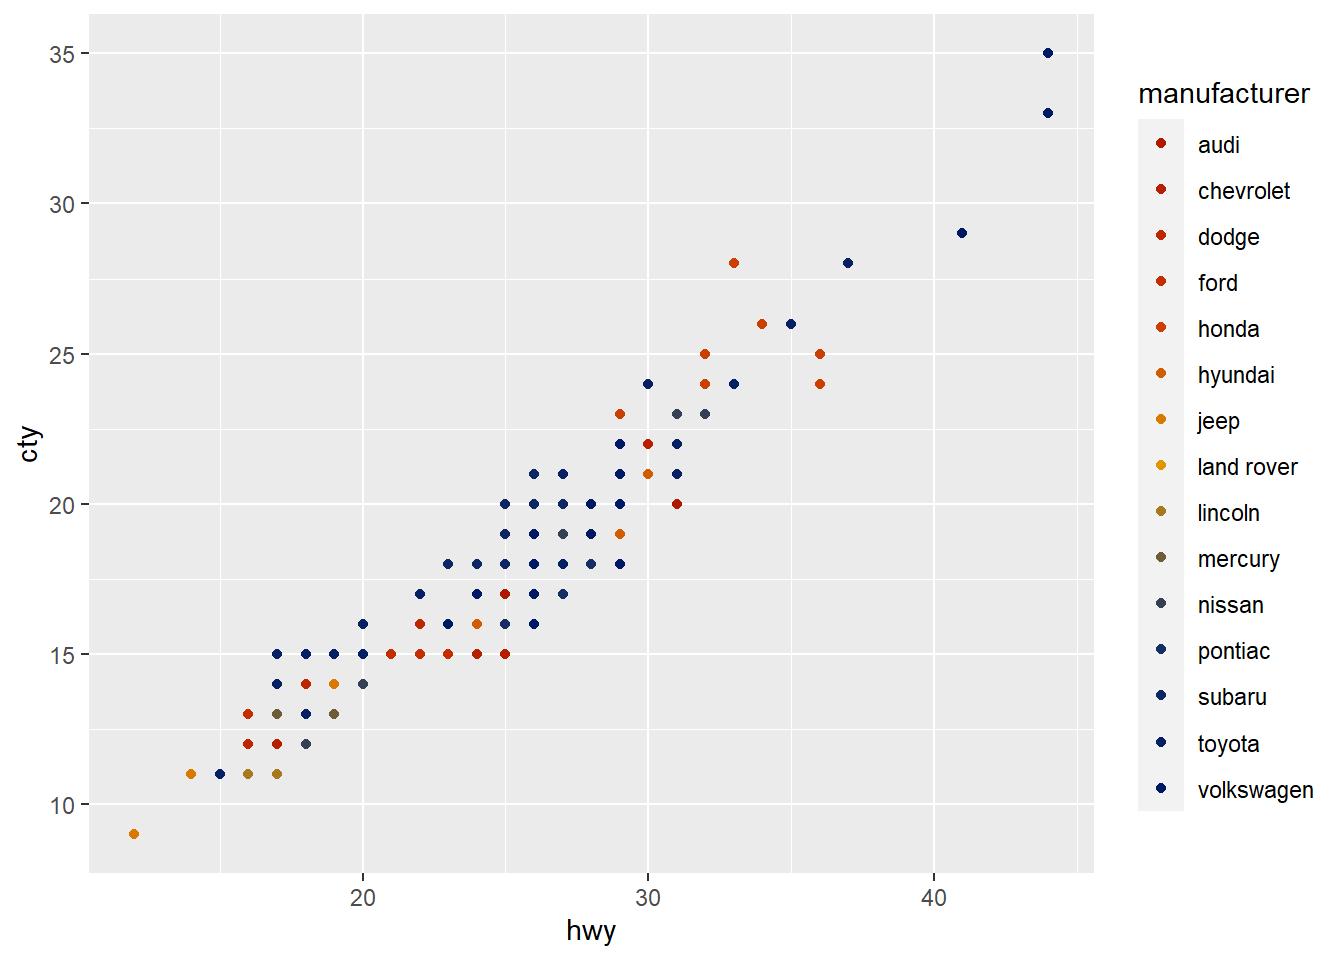
A third, nice to have aspect of ggplot2 palettes is that often you can visualise the palettes to decide which ones you want.
As we are now talking about several user defined functions that we want to call repeatedly in many different environments, we want to package them all up.
If you have branding guidance you want to follow, part of this is taken care of for you, if you just want to find some colours that look good together see below. Either way, you should end up with a list of colours with their hex codes.
If you don’t already have your colours in mind, there are a number of tools you can use to generate palettes that look good. Some fun ones:
For this example, I’ll choose a random palette from ColorPalettes, Palette 4562. These colours are:
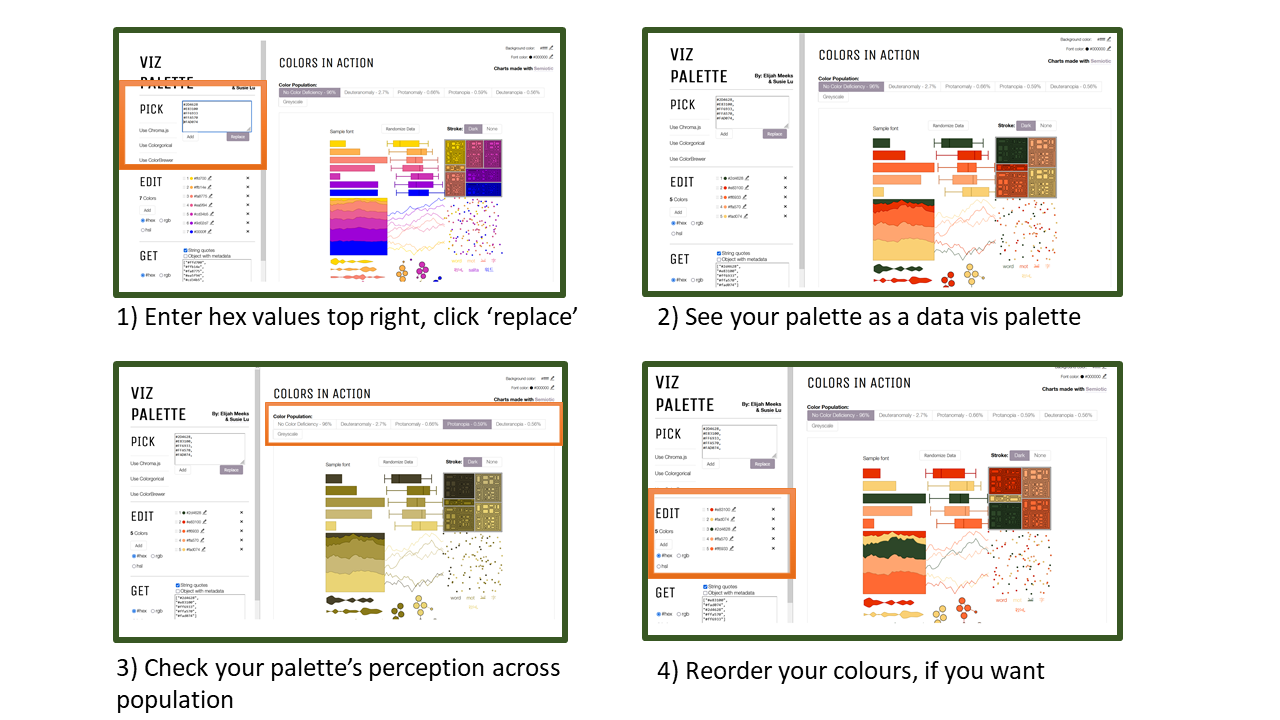
At this point, we need to think about how colours look in data visualisation. Luckily, there is already an excellent tool for this: viz-palettes made by Susie Lu and Elijah Meeks (Thanks folks!).
Go to viz-palettes and enter your string of hex characters in the top left box (remember to add a comma after each colour and don’t forget the hash!).
Click ‘replace’ to change the colours.
Check how your colours work with different population types, e.g. people who are colour blind by exploring the top right buttons.
Reorder your colours if you want.
Everything you need to know about package creation is already in Hadley Wickham and Jennifer Bryan’s R Packages (2e) book, but this is a really quick run down. Assuming you’re in R Studio, but importantly not yet in the directory you want to make your package in, run:
usethis::create_package("your/specific/path/to/your/new/package/directory")Once you have your new project up and running (you’ll see it comes with the package structure already, e.g. an R folder, etc.), you want to connect to github (NB: If you don’t have or don’t want a repository you can skip this step).
usethis::use_github()This should create a new repository in your github, but if it doesn’t check out Jenny Bryan’s book - Chapter: GitHub Last. The reason I set it up this way is because I have found usethis::create_package gets a little grumpy if its not the first thing you do. YMMV as may your workflow.
Most ggplot2 palettes have three basic files:
Using devtools means that you use roxygen documentation which has a special comment #'. In the header of each file you describe the function any parameters it needs. Your first file doesn’t need much. In this example, I’ll use just two palettes.
#' My lovely palette collection
#'
#'
#' @examples
#' # Generate a plot using my palettes with my functions
#' library(ggplot2)
#' ggplot(aes(x = hwy, y = cty, colour = manufacturer ), data = mpg) +
#'   geom_point() +
#'   scale_colour_me()
#'
#'
#'


my_pals <- list(orange_and_green = c("#2D4628",
                                     "#E83100",
                                     "#FF6933",
                                     "#FFA570",
                                     "#FAD074"),
                yellows = c("#FF6933",
                            "#FFA570",
"#FAD074"))This is the bigger one and contains four functions(ish).
A function to look at your specified palette and use colorRampPalette to get it to whatever number of colours you want
A function to create a usable colour palette using the previous function
A function to make a ggplot colour scale
A function to make a ggplot fill scale
#' A helper function which modifies a given palette by ramping to specified length
#'
#' @param n Number of colours you want in your palette, defaults to n colours in palette
#'
#' @param palette Choose from 'my_pals' list
#'
#' @param alpha transparency
#'
#' @param reverse If TRUE, the direction of the colours is reversed.
#'
#' @importFrom grDevices colorRampPalette
#'
#' @examples
#' library(my_colours)
#' image(volcano, col = my_col("bright", 20))
#' @export


my_col <- function(palette = "bright", n, alpha = 1, reverse = FALSE) {

  pal <- my_pals[[palette]]

  if (is.null(pal))
    stop("Palette not found.")

  if(missing(n)) {
    n <- length(pal)
  }

  if (reverse) {
    pal <- rev(pal)
  }

  pal <- colorRampPalette(pal, alpha)(n)

  return(pal)

}

#' Creates a palette from your specified colours
#'
#' @param palette Choose from 'my_pals' list
#'
#' @param alpha transparency
#'
#' @param reverse If TRUE, the direction of the colours is reversed.
#'
#' @importFrom grDevices colorRampPalette


make_my_palette <- function(palette = "bright", alpha = 1, reverse = FALSE) {

  function(n) {
    my_col(palette, n, alpha, reverse)
  }

}


#' Creates a colour scale for ggplot2
#'
#'
#' @param palette Choose from 'my_pals' list
#'
#' @param reverse logical, Reverse the order of the colours?
#'
#' @param alpha transparency
#'
#' @param discrete whether to use a discrete colour palette
#'
#' @param ... additional arguments to pass to scale_color_gradientn
#'
#' @importFrom ggplot2 scale_colour_manual
#'
#' @examples
#' library(ggplot2)
#' library(my_colours)
#'
#' ggplot(mpg) +
#'  geom_point(aes(x = hwy, y = cty, color = manufacturer)) +
#'  scale_color_me("orange_and_green")
#'
#' @export
#'
#' @importFrom ggplot2 discrete_scale scale_color_gradientn
#'


scale_colour_me <- function(palette = "orange_and_green", discrete = TRUE, alpha = 1, reverse = FALSE, ...) {

  if (discrete) {
    discrete_scale("colour", "my_col", make_my_palette(palette, alpha = alpha, reverse = reverse), ...)
  }
  else {
    scale_color_gradientn(colours = my_col(palette, 256, alpha = alpha, reverse = reverse), ...)
  }
}


#' Creates a  fill scale for ggplot2
#'
#' @param palette Choose from 'my_pals' list
#'
#' @inheritParams viridis::scale_fill_viridis
#' @inheritParams my_pals
#'
#' @param discrete whether to use a discrete colour palette
#'
#' @param ... additional arguments to pass to scale_color_gradientn
#'
#' @importFrom ggplot2 scale_fill_manual discrete_scale scale_fill_gradientn
#'
#' @examples
#' library(ggplot2)
#' library(my_colours)
#'
#' ggplot(aes(x = manufacturer, fill = manufacturer), data = mpg) +
#'   geom_bar() +
#'   scale_fill_me()
#' @export
#'


scale_fill_me <- function(palette = "orange_and_green", discrete = TRUE, alpha = 1, reverse = FALSE, ...) {

  if (discrete) {
    discrete_scale("fill", "my_col", make_my_palette(palette, alpha = alpha, reverse = reverse), ...)
  }
  else {
    scale_fill_gradientn(colours = my_col(palette, 256, alpha = alpha, reverse = reverse), ...)
  }
}This is ‘nice to have’ element of the package. One of my ‘to-do-list’ issues with UoEColouR is figuring out how to get this function to run on all palettes, but that’s for another day.
#' Show a given colour palette from your package
#'
#' Given a character vector (hex RGB values), display palette in graphics window.
#'
#' @param palette vector of character hex RGB values
#' @export
#' @examples
#' library(my_colours)
#' see_my_palette("orange_and_green")


see_my_palette <- function(palette) {

  name <- palette

  palette <- my_col(palette)

  n <- length(palette)

  if (length(palette > 0)) {

    graphics::image(1:n, 1, as.matrix(1:n), col = palette,
                    xlab = "", ylab = "", xaxt = "n", yaxt = "n",
                    bty = "n")
    graphics::title(main = name)

  }
}Using devtools we can automatically turn those roxygen comments to documentation and build the package, installing it to your PC.
devtools::document()
devtools::build()
devtools::install()
Now you can push your changes to git and your package will be done!
see_my_palette("yellows")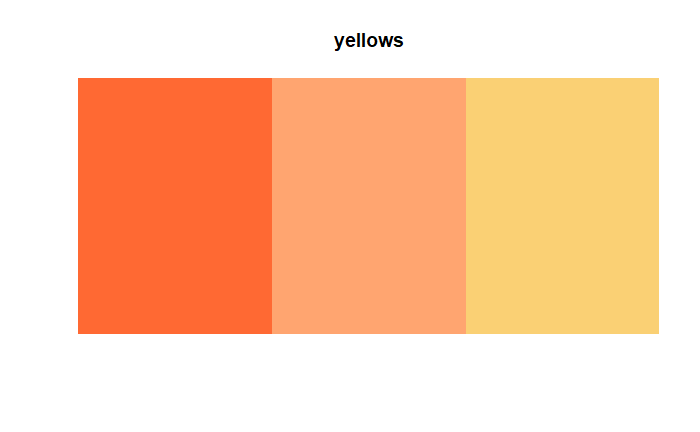
ggplot(aes(x = hwy, y = cty, colour = manufacturer), data = mpg) +
  geom_point() +
  scale_colour_me(palette = "orange_and_green")